
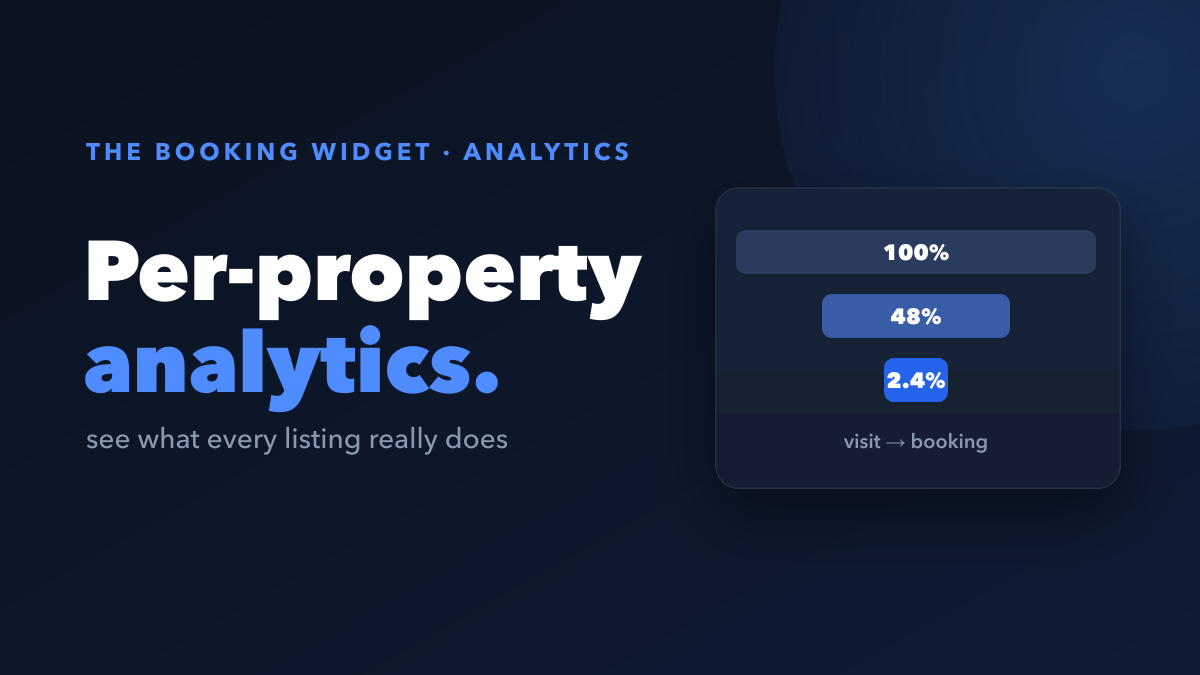
Most booking widgets are a black box. You see the bookings that come through and nothing else. The Booking Widget shows you the full picture instead: real-time stats for every listing, so you know which properties convert, where guests drop off, and what to fix.
What does per-property analytics actually show?
For each property, you get its own stats in real time. Not a single blended number for your whole account, but a breakdown you can read listing by listing:
- Lost baskets: guests who started a booking on that listing but never finished.
- Booking intent: how many people picked dates and were serious about booking.
- Conversion rate: how well that listing turns interest into paid stays.
- Drop-off: where in the flow guests are leaving.
- Revenue: what each property is actually bringing in.
- Occupancy: how full each listing is.
Because everything is split per property, you can compare listings side by side and spot the outliers instantly.
Why is an account-wide average not enough?
An account average hides your problems. If one listing converts at 8% and another at 1%, a combined figure might look fine while a property quietly leaks bookings every week.
Per-property data lets you ask the right questions. Is this listing getting plenty of intent but poor conversion? Then the issue is likely price, photos, or the description. Is it getting no intent at all? Then it is a visibility or demand problem, not a checkout one. The numbers point you straight at the fix.
How does this compare to a typical widget?
| Most widgets | The Booking Widget | |
|---|---|---|
| Stats per listing | No, account average only | Yes, full breakdown |
| Lost baskets | Hidden | Shown per listing |
| Drop-off point | Unknown | Visible |
| Real time | Rarely | Yes |
| Your own Google Analytics | Not supported | Optional, alongside built-in |
Built in, or bring your own Google Analytics
The analytics are built in and work out of the box. There is nothing to install and no dashboard to wire up. Open your account and the numbers are already there.
If you already run your reporting somewhere else, you can also connect your own Google Analytics and keep using the tools you know. Many hosts do both: the built-in view for fast, listing-level answers, and Google Analytics for deeper custom reporting. The choice is yours.
Turning insight into recovered bookings
Seeing the data is only half the value. The other half is acting on it. Per-property analytics pairs naturally with two recovery features:
- Lost Basket. When a listing shows a stack of lost baskets, you can see exactly who tried to book and follow up, so near-misses become confirmed stays.
- Comeback Offer. For a listing with high intent but weak conversion, an automatic discount when a guest returns can be the nudge that closes the gap.
The analytics tell you which listing needs help, and these features help you recover the bookings that were slipping away.
Key takeaways
- The Booking Widget shows full real-time stats for every listing, not just an account-wide average.
- You see lost baskets, booking intent, conversion, drop-off, revenue, and occupancy per property.
- Per-property data reveals which listings convert and where guests leave, so you know what to fix.
- Analytics are built in and work out of the box, and you can also connect your own Google Analytics.
- It pairs with Lost Basket and Comeback Offer to recover the bookings you can now see slipping away.
- It stays free to use, with a simple 4% per booking and payouts to your own Stripe.
Stop guessing which listings work. With per-property analytics you can see it, and with The Booking Widget you can fix it. Add The Booking Widget to your site and turn your stats into more direct bookings.